Sponsored by Monday Properties and written by ARLnow, Startup Monday is a weekly column that profiles Arlington-based startups, founders, and other local technology news. Monday Properties is proudly featuring 1812 N. Moore Street in Rosslyn.
(Updated 1:20 p.m.) Arlington resident and avid cyclist Carla Uriona spends most of her time demystifying data for people.
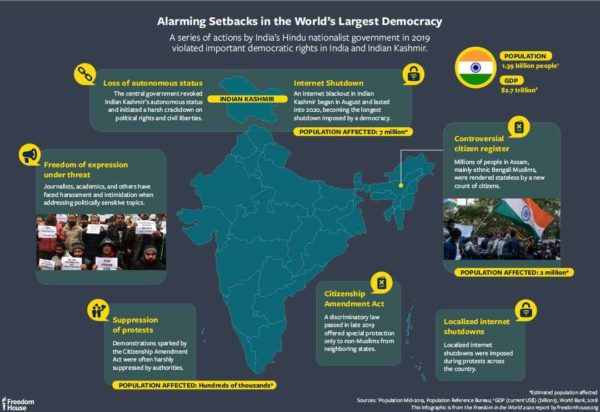
The English major-turned-coder-turned-designer is the co-founder of Factor3 Digital, a small, Arlington-based design company that creates data visualizations for nonprofits and corporations. In addition to design projects, she and co-founder Evan Potler spend a good deal of time helping prospective and current clients understand the fundamentals of responsible data visualization so they can do the work in-house if they wanted.
“Not enough agencies take that mentoring perspective,” she said.
Uriona founded Factor3 Digital partly out of frustration. The nonprofit firms she worked for, which farmed out some of their digital operations to contractors, often called on her to “translate” what the firms were doing.
“I think that those of us who are in these specialized fields, we live in our heads all the time,” she said. “Some don’t want people to see the ‘magic formula,’ and I fundamentally disagree with that so much.”
 So in 2017, she and Potler, who had worked together at three nonprofits before, took the plunge to “be the firm we wish we could have hired” — the one that takes the time to cultivate relationships with clients and mentor them.
She said the pandemic led her and Potler to do some soul-searching about how much they want the company to grow or take on new clients.
“We had no idea before the pandemic how much we needed our clients and how much relationships mattered,” she said. “We’ve decided that we want to stay small enough so that we can personally focus on the majority of projects.”
Although it means sacrificing large-scale growth, Uriona — who has always worked for nonprofits — said she feels fulfilled in her work. About 80% of Factor3 Digital’s work is with nonprofits, and work with corporations makes up the remaining 20% and subsidizes the lower rates Factor3 Digital offers to nonprofits.
“The folks who are corporate know that — I wonder if it makes them feel good about the work they do,” she said.
The pandemic has led to more soul-searching among designers who work with data. Graphics of case numbers and transmission rates are everywhere but prone to misinterpretation, which can be deadly, she said.
“That points to a need for data literacy in schools,” she said. “I assure you, I’m going to make sure my son, who’s in sixth grade, knows how to read data.”
But the responsibility also falls to designers, who have to do a better job designing charts and graphics that regular people can understand.
“I don’t think we have gotten there yet,” she said.
This reckoning started before the pandemic as data became democratized and products to make graphics became more readily accessible.
“Rather than working inside your gated data community, designers are having a lot more conversations about our responsibility to make that data easy to understand and clear to the public at large,” she said.
For that reason, Uriona incorporates her background in not just coding and designing, but also writing, into her work as she strives to make graphics clear and concise. She first saw how these three fields interacted when she and her team brought Pew Charitable Trust its first-ever data visualization experiences and products.
These learning experiences have been constant, and she admits, “it’s been hard.”
“I think if you stop learning, you stop achieving,” she said. “Being a woman, I think, in a field that sometimes is more male-dominated has made me more tenacious about keeping my skills current.”
Uriona is also an immigrant from Bolivia, who came to the U.S. at seven years old, and a lesbian. But she said none of that has impacted her career in the ways she thought it could, which she chalks up to the strength of the small community of women in data visualization.
“I haven’t really had a bad experience in my career,” she said. “I’m either very lucky or very blind.”
Photos courtesy Carla Uriona


