This regularly scheduled column is written by Eli Tucker, Arlington-based Realtor and Arlington resident. If you would like to work with Eli and his team in Northern Virginia and the greater D.C. Metro area, you can reach him directly at [email protected].
Question: Can you highlight the key market trends you’re seeing in the housing market?
Answer: Today we’ll look at three charts that describe what I’m currently seeing in the DC Metro, Northern VA, and Arlington housing market.
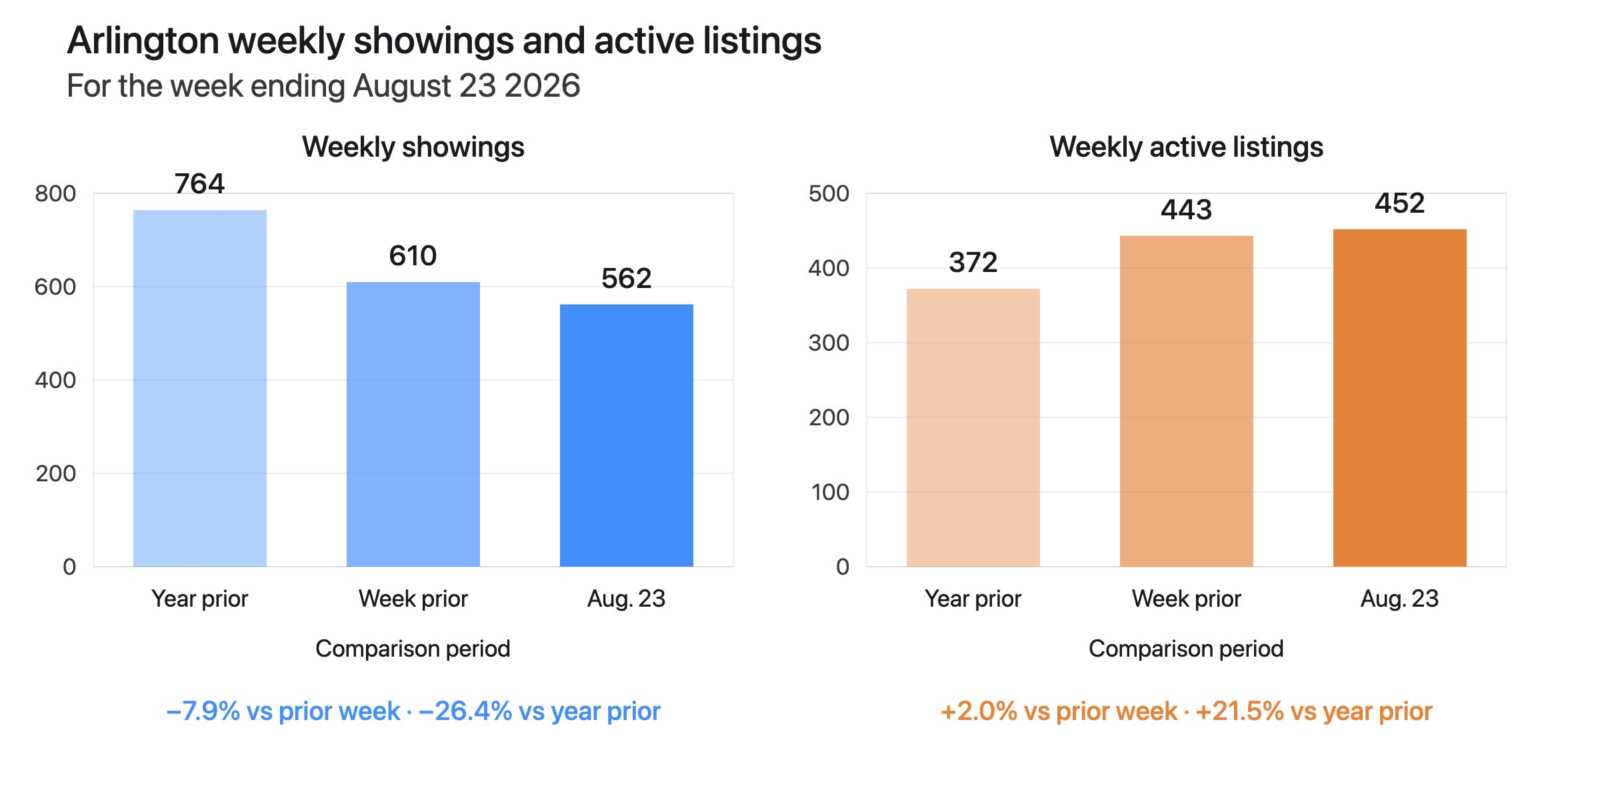
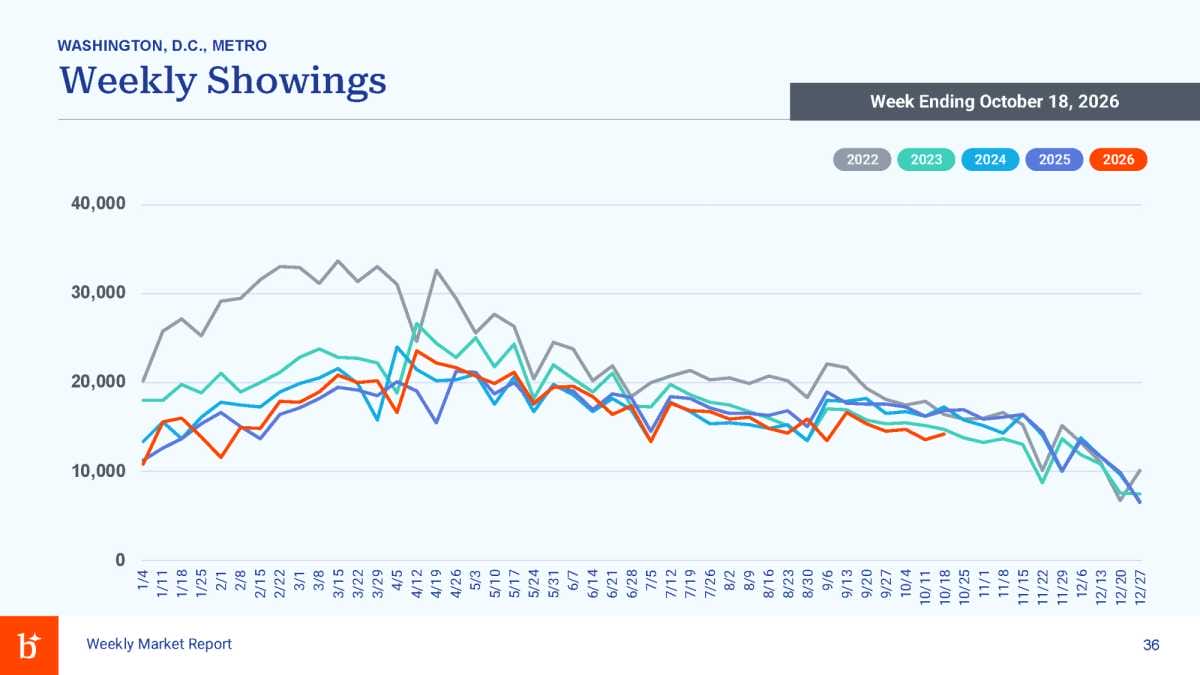
Showing Volume Down Significantly in the DC Metro
Weekly showing volume in the DC Metro has been running at its lowest rate in 5+ years since the beginning of September. Last week, showings were down 16% year-over-year (YoY).
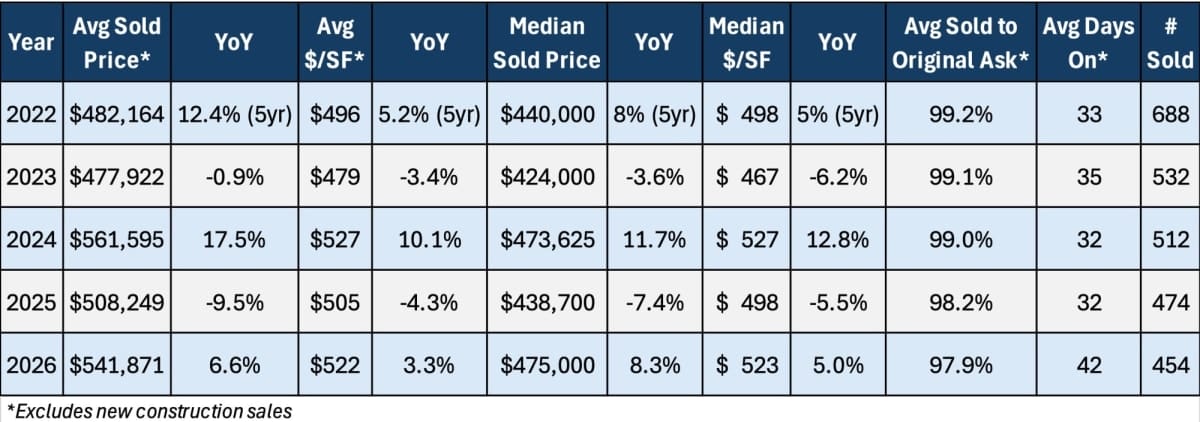
Most Detached Homes Available in Seven Years in Northern VA
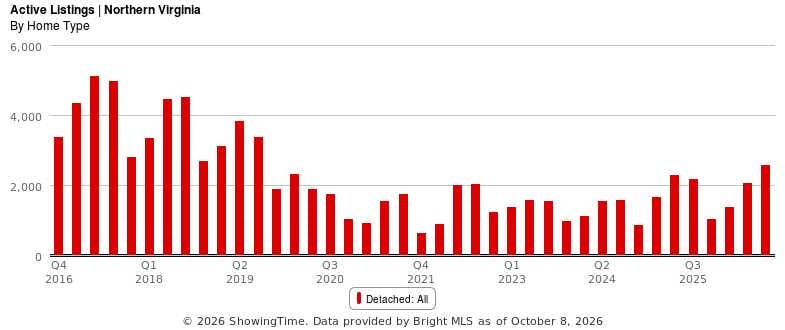
There haven’t been this many single-family detached homes available for sale in Northern VA since October 2019. The number of detached homes for sale in Q3 increased by 38% YoY in 2025 and another 17% in 2026.
That said, detached inventory levels are still well below pre-pandemic levels.
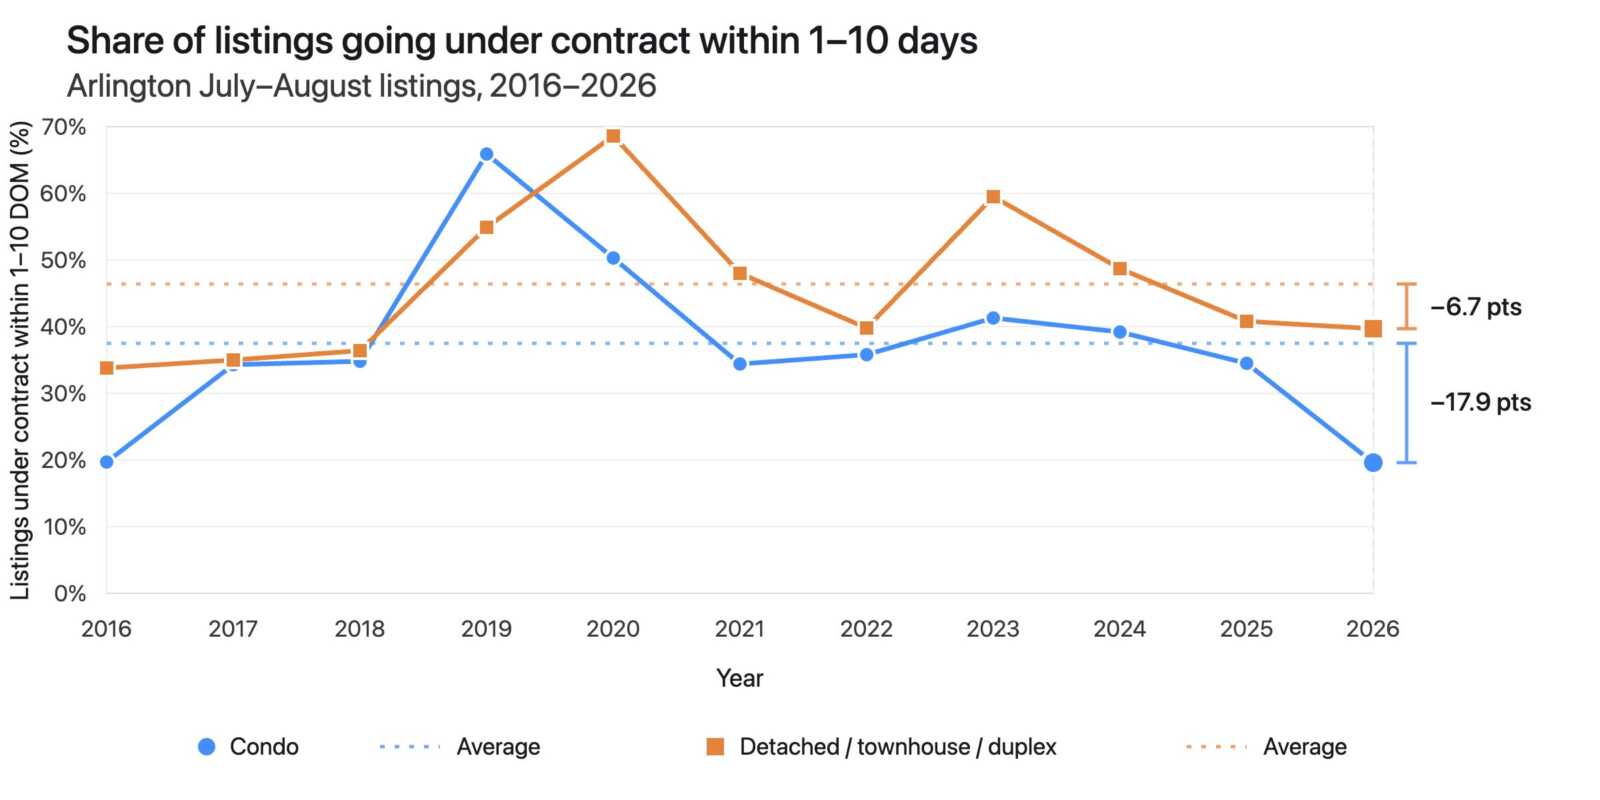
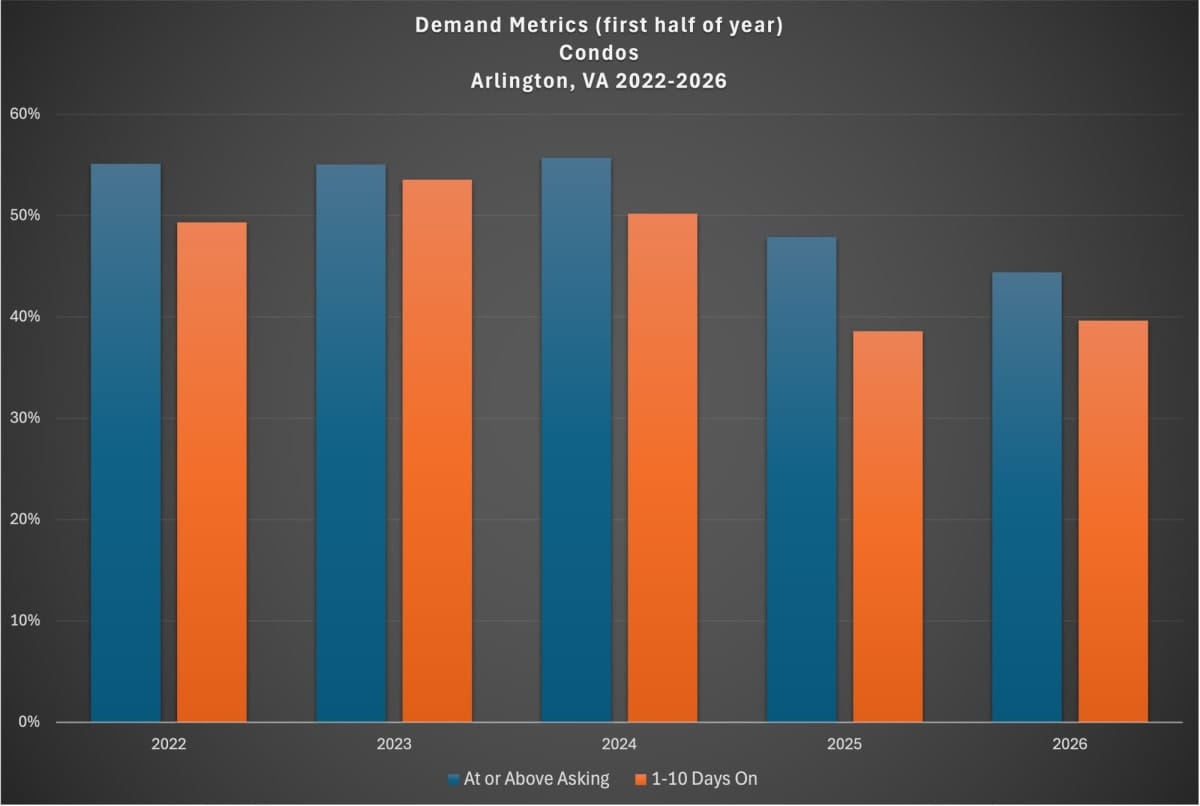
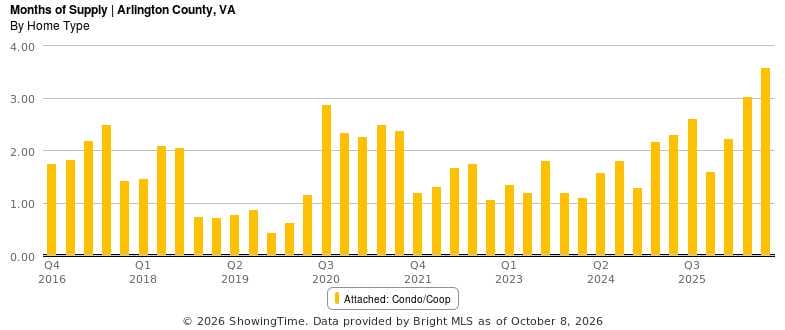
Months of Supply at Ten-Year High for Arlington Condos
The Arlington condo market has the highest Months of Supply (a measure of supply and demand) readings and lowest absorption readings in over ten years. Expect these trends to continue at least through the end of the year, with MoS going higher and Absorption dropping further.
If you’d like to discuss buying, selling, investing, or renting, don’t hesitate to reach out to me at [email protected].
We have access to the most pre and off-market listings across the DMV of any brokerage and are happy to share what’s available with anyone who asks.
Below are some of our team’s pre/off-market listings, details and additional listings available by request:
-
Arlington VA (Barcroft) – 4BR/2BA/2,500 sqft – Detached Single Family – 4th St S Arlington VA 22204
-
Arlington VA (Chain Bridge Forest) – 6BR/6.5BA/7,000 sqft – Detached Single Family (2027) – River St Arlington VA 22207
-
Fairfax VA – 6BR/6.2BA/7,000 sqft – Detached Single Family (2027) – Taylor Dr Fairfax VA 22032
-
Mclean VA – 5BR/4.5BA/3,700 sqft – Detached Single Family (2023) – Randolph Rd Mclean VA 22101
-
Annandale VA – 4BR/3.5BA/2,000 sqft – Townhouse – Aspen Hill Ct Annandale VA 22003
Eli and his team believe that your real estate needs should be managed by advisors, not salespeople. Their mission is to guide, educate, and advocate for their clients through real advice, hands-on support, and personalized service.